Figures are learned at month end
Mid-month, where you stand isn’t clear. And there’s no chance left to correct course.

Features
The 41 features in our plans plus the core modules included in every plan. All of them work on the same patient record.
All featuresSpecialties
Appointments, patient record and finance are the same in every specialty. The examination screen adapts to yours.
All specialtiesClineo Lab
Turn the case sent by a clinic into a work order, follow production on a board and manage each clinic’s account in one place.
Dental lab softwareResources
Articles on regulations, switching systems and day-to-day operations.
All articlesBasic Reporting
Follow appointments, payments and patient activity with simple indicators. Decide with real data, not opinions.
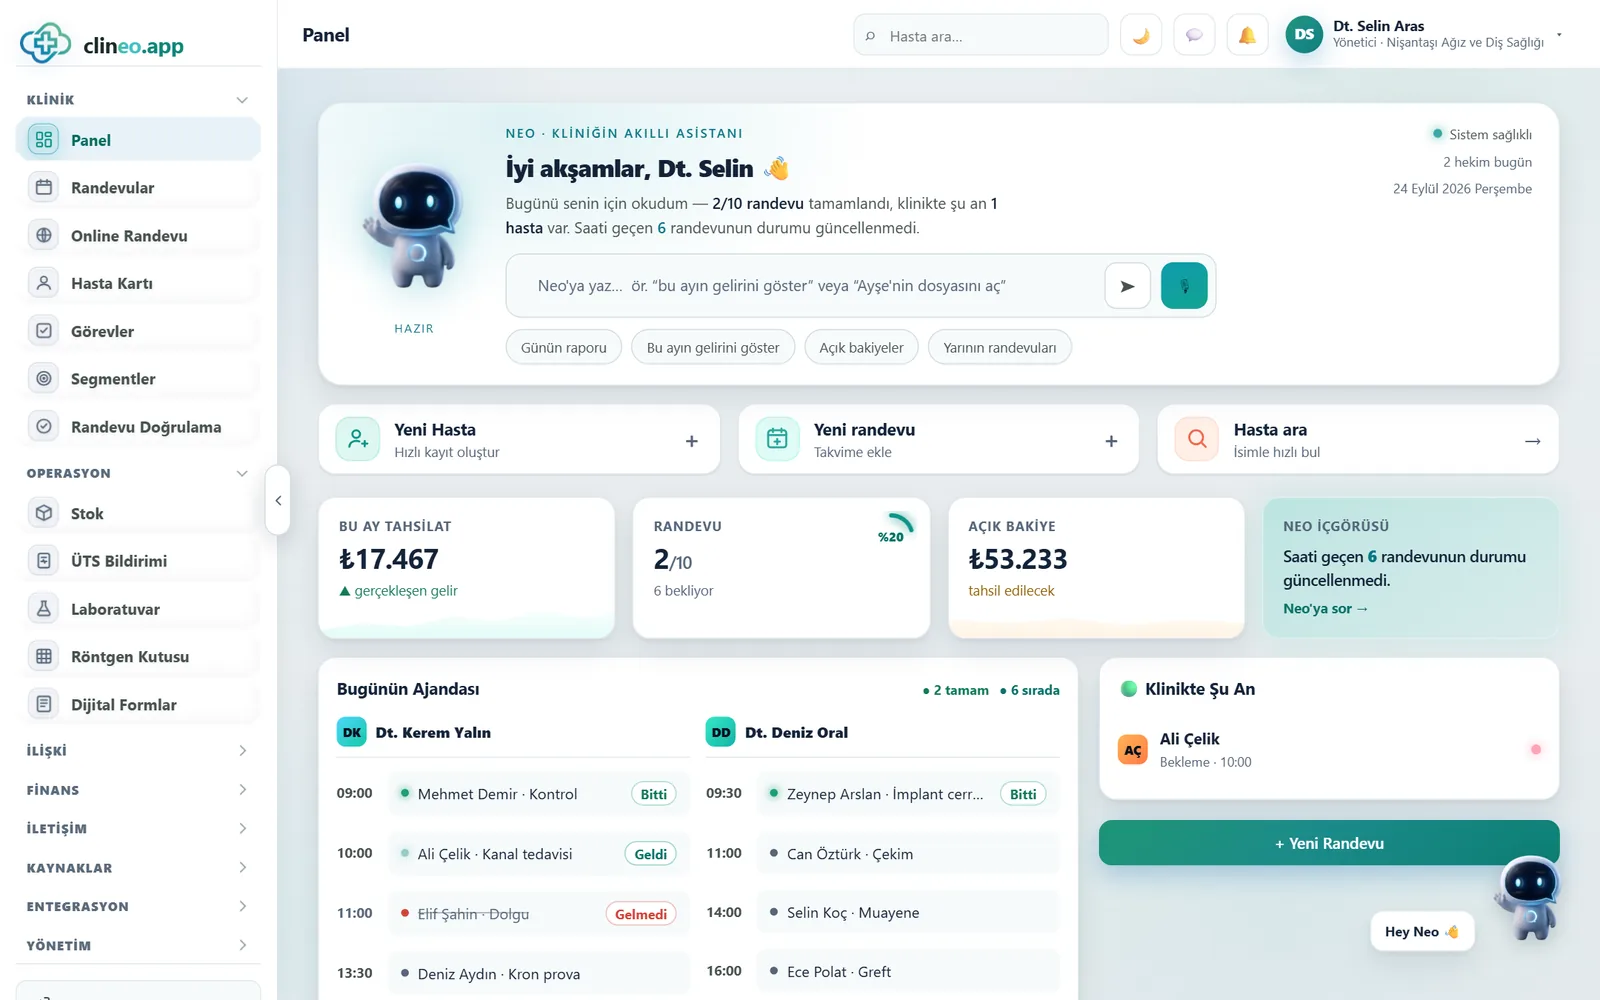
Clarity, not clutter
See indicators such as daily appointments, monthly payments, new patients and occupancy in simple charts. If you want to dig into detail, open the breakdown.
Familiar problems
Turnover is felt, but when it isn’t discussed in numbers, decisions rest on guesswork.
Mid-month, where you stand isn’t clear. And there’s no chance left to correct course.
When output is discussed, everyone has a different figure in mind.
The calendar looks full, but without measuring occupancy, lost hours slip by.
What changes
You do the same work; you don’t wait until month end to see the result.
Decisions are made by feel.
A simple dashboard — Appointments, payments and new patients on one screen. Clear at a glance, no interpretation needed.
Who produced what isn’t clear.
Per-doctor breakdown — Each doctor’s output is visible separately. The figure comes from the data; the argument ends.
Empty hours are quietly lost.
Occupancy rate — You measure how full the calendar is; you notice empty hours and fill them.
Why Clineo
Reports run on live data and update themselves.
Appointments, payments and patient numbers appear without clutter.
Compare today and the month’s trend on the same screen.
Collected and outstanding amounts are always clear.
Easily see how much each doctor produced.
Measure calendar occupancy and notice empty hours.
Print or share the summary report.
How it works
Reports update themselves as appointments and payments are entered.
The main indicators greet you.
Choose a day, week or month.
Filter by doctor, procedure or patient.
Print the summary or share it with the team.
Works together with
A report doesn’t produce data on its own; it’s fed by the clinic’s daily records.
occupancy and appointment counts come from the calendar
payments and outstanding amounts are read from finance
output is calculated from treatment records
dig deeper into missed revenue in a separate report
link the output figure to commission calculations
AI assistant
When you ask "how much have we collected this month" or "how many appointments today", Neo gives the answer. You get the day’s summary without opening the report screen and setting filters.
Where to start
When you first open the report screen, choosing which indicator to look at can feel hard. The fastest way: for a week, look at only two figures — daily appointment count and amount collected. These two give you the clinic’s pulse. Once you’re used to them, you move on to the per-doctor breakdown and occupancy rate. Since reports run on live data, there’s no separate preparation step; indicators fill in as records are entered.
New · 23 September
Reports are cut on Turkey time; a payment late at night doesn’t slide into the next day.
You get the report and the patient file as a PDF.
FAQ
If your answer isn’t here, you can ask us directly in the demo call.
Ask in the demoReady when you are
Let’s plan a short walkthrough for your specialty so you can see this feature in your own clinic workflow.